


Statistics
Introduction to Statistics
We are surrounded by statistics in everything from social media trends to stock markets, medical research, exam results, sports scores, weather forecasts, and surveys. However, statistics is more than just numbers; it's also about interpreting data and deriving insightful conclusions.
Data organisation, analysis, interpretation, and presentation are all aided by statistics. A solid foundation in statistics empowers you to use logical reasoning to solve real-world problems, whether you're in school or preparing for competitive exams.
Table of Contents
- Definition of Statistics
- Types of Statistics Explained
- Data and Its Types
- Important Formulae in Statistics
- Summary Table
- Conclusion
- FAQs on Statistics
Definition of Statistics
The area of mathematics known as statistics is concerned with the gathering, arrangement, analysis, interpretation, and display of data.
It provides answers to queries like:
-
What is a class's average score?
-
What is the probability of rain tomorrow?
-
Are two products operating in different ways?
-
Is this sample result trustworthy?
Types of Statistics Explained
There are two major branches of statistics:
Descriptive statistics describe the appearance of your data.
Using smaller samples, inferential statistics helps you make educated guesses about what might be true about a larger group.
1. Descriptive Statistics
Descriptive statistics can be thought of as a story summary. You want to explain a large collection of numbers in a straightforward manner that people can understand.
Example:
For instance, let's say your class took a maths test. Everybody received a score out of 100. Finding the average score is made easier with the use of descriptive statistics.
-
Who had the highest score?
-
Are scores widely dispersed, or are everyone receiving roughly the same grades?
-
What is the overall appearance of the performance?
Key Tools in Descriptive Statistics
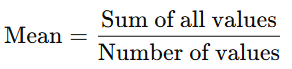
1. Mean (Average)
What it does:
-
Adds up all values and divides by how many there are.
Formula:
Example:
Scores: 80, 90, 85
Mean = (80 + 90 + 85) ÷ 3 = 85
2. Median
What it does:
-
Finds the middle value when numbers are sorted in order.
Example:
Scores: 70, 75, 80
Median = 75 (middle number)
If there’s an even number of scores, median = average of the two middle numbers.
3. Mode
What it does:
-
The number that appears most often.
Example:
Scores: 70, 70, 75, 80
Mode = 70
4. Range
What it does:
-
Measures spread from lowest to highest.
Formula:
Range=Highest value−Lowest value
Example:
Scores: 60, 90 → Range = 90 – 60 = 30
5. Variance
What it does:
-
Measures how spread out data is around the mean.
Formula (Population Variance):
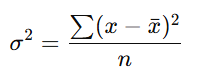
Plain English:
-
Variance shows how far scores are from the average. Higher variance = more spread out data.
What it does:
-
Tells you the typical distance scores are from the mean.
Formula:
![]()
Plain English:
-
A smaller standard deviation means most values are close to the mean.
7. Tables, Graphs, and Charts
Purpose:
-
Show data visually so you can quickly spot patterns.
Examples:
-
Bar Graph → shows categories
-
Histogram → shows frequency of ranges
-
Pie Chart → shows proportions
-
Line Graph → shows trends over time
Why is it useful?
People understand pictures faster than long lists of numbers!
2. Inferential Statistics
Your data is described by descriptive statistics. Furthermore, inferential statistics allows you to draw conclusions about a larger group from your sample.
Example:
Consider asking 50 students at your school how many hours they spend studying each day. You want to guess how the school's five hundred students study.
Inferential statistics uses a sample to draw conclusions about the population.
Key Tools in Inferential Statistics
1. Hypothesis Testing
Purpose:
-
aids in verifying the accuracy of your hypotheses or assertions regarding a population.
Example question:
-
Do boys and girls at my school spend the same amount of time studying?
How it works:
-
Establish a null hypothesis, which states that nothing out of the ordinary is occurring.
-
Compile information and determine a test statistic.
-
Check to see if the outcome is severe enough to disprove the null hypothesis.
-
Determine whether there is sufficient evidence to support your initial belief.
2. Confidence Intervals
Purpose:
-
provides a range of values that correspond to the true population value.
Example:
-
"I'm 95% certain that all of the students at my school are between 5.4 and 5.6 feet tall on average."
What makes it beneficial?
Confidence intervals display the accuracy of your estimate rather than a single figure.
3. Regression Analysis
Purpose:
-
makes predictions about one variable based on another.
Example:
-
estimating grades based on study hours.
Simple Linear Regression Equation:
y=a+bx
-
y → what you want to predict (e.g. marks)
-
x → predictor variable (e.g. hours studied)
-
a → intercept
-
b → slope (change in y for each extra unit of x)
4. Probability Distributions
Purpose:
-
Helps understand how likely different outcomes are.
There are many types, but the most common are:
Binomial Distribution
-
Used when:
-
Only two outcomes exist (success/failure).
-
Fixed number of trials.
Example:
-
Tossing a coin 10 times - how many times will it come up heads?
Poisson Distribution
-
Used for counting events happening in a fixed interval of time or space.
Example:
-
Number of emails you get per hour.
Normal Distribution
-
Bell-shaped curve.
-
Data is symmetrically spread around the mean.
-
Many things in real life follow this distribution (like heights or test scores).
Why is it useful?
-
Helps make predictions.
-
Forms the backbone of many statistical tests.
Why Descriptive and Inferential Statistics Are Both Important
-
Descriptive statistics helps you understand your current data.
-
Inferential statistics helps you predict and make decisions about bigger groups.
Both are essential because:
-
You first describe what’s happening (descriptive).
-
Then you infer or predict beyond your data (inferential).
Data and Its Types
-
Everything in statistics starts with data. Data is simply information collected for analysis. It can be numbers, words, or observations.
-
Understanding the types of data is essential because the type of data determines which statistical methods you can use.
Qualitative and Quantitative Data
1. Qualitative Data (Categorical Data)
-
Deals with qualities or categories rather than numbers.
-
Cannot be measured mathematically but can be sorted into groups.
Examples:
-
Eye color → Blue, Brown, Green
-
Types of fruits → Apple, Banana, Orange
-
Gender → Male, Female, Other
-
Yes/No survey responses
Why is it important?
-
Helps classify data into meaningful groups.
-
For qualitative data, we often use frequency counts or percentages to describe them.
2. Quantitative Data (Numerical Data)
-
Deals with numbers and can be measured.
-
Can be added, subtracted, averaged, etc.
Quantitative data is split into two types:
Discrete Data
-
Takes whole numbers only (no fractions or decimals)
-
Countable.
Examples:
-
Number of students in a class
-
Number of cars in a parking lot
-
Goals scored in a football match
3. Continuous Data
-
Can take any value within a range, including fractions and decimals.
-
Measurable, not countable.
Examples:
-
Height of students (like 152.5 cm)
-
Weight of apples
-
Temperature readings
Why is it important?
-
Helps choose appropriate graphs (e.g., histograms for continuous data, bar charts for discrete).
-
Influences which statistical tests you can perform.
Primary and Secondary Data
1. Primary Data
-
Data collected directly by you for a specific purpose.
-
Original and first-hand.
Examples:
-
Conducting a survey in your class about favorite subjects
-
Measuring students’ heights for a project
-
Observing bird species in a park
Advantages:
-
Accurate and specific to your purpose.
Disadvantages:
-
Takes more time and effort to collect.
2. Secondary Data
-
Data collected by someone else, but you’re using it for your own study.
-
Second-hand information.
Examples:
-
Reading data from textbooks or research papers
-
Downloading data from government websites
-
Using statistical tables published in reports
Advantages:
-
Saves time and money.
Disadvantages:
-
May not perfectly fit your research purpose.
-
Might be outdated or less reliable.
Levels of Measurement
The level of measurement defines how precisely your data can be measured or analyzed. There are four levels - from simple to complex:
1. Nominal Scale
-
Categories with no logical order.
-
Used for labeling only.
Examples:
-
Types of animals → Dog, Cat, Bird
-
Colors → Red, Blue, Green
-
Gender → Male, Female
Key point:
-
You can count how many fall into each category but can’t say one is “greater” than the other.
2. Ordinal Scale
-
Categories with a meaningful order, but the differences between them are not measured precisely.
Examples:
-
Movie ratings → Excellent, Good, Fair, Poor
-
Education levels → High school, College, Postgraduate
-
Customer satisfaction → Very satisfied, Satisfied, Neutral, Dissatisfied
Key point:
-
You know the order but can’t measure exactly how much better or worse one is from another.
3. Interval Scale
-
Data has an order, and you can measure exact differences between values, but there’s no true zero point.
Examples:
-
Temperature in Celsius or Fahrenheit (0°C doesn’t mean “no temperature.”)
-
Dates on a calendar
Key point:
-
You can add and subtract but ratios don’t make sense. For instance, 20°C is not “twice as hot” as 10°C.
4. Ratio Scale
-
Data has all the properties of interval data and a true zero point.
-
You can compare values using multiplication or division.
Examples:
-
Height (0 cm means no height)
-
Weight (0 kg means no weight)
-
Age (0 years means no age)
Key point:
-
You can say things like “Person A weighs twice as much as Person B.”
Important Formulae in Statistics
|
Concept |
Formula |
|
Mean (Average) |
Mean = (Sum of all observations) / (Number of observations) |
|
Median (Ungrouped Data) |
Median = Middle value (when data is arranged in ascending order) |
|
Median (Even Number of Items) |
Median = (n/2)th term + ((n/2) + 1)th term / 2 |
|
Mode (Ungrouped Data) |
Mode = Value that appears most frequently |
|
Range |
Range = Maximum value - Minimum value |
|
Mean (Grouped Data) |
Mean = Σ(f × x) / Σf where f = frequency, x = mid-value of each class |
|
Class Mark (x) |
x = (Lower limit + Upper limit) / 2 |
|
Median (Grouped Data) |
Median = l + [(N/2 – CF) / f] × h |
|
Where: l = lower boundary of median class, |
|
|
N = total frequency, CF = cumulative frequency before median class, |
|
|
f = frequency of median class, h = class width |
|
|
Mode (Grouped Data) |
Mode = l + [(f₁ – f₀) / (2f₁ – f₀ – f₂)] × h |
|
Where: l = lower boundary of modal class, |
|
|
f₁ = frequency of modal class, f₀ = frequency of previous class, |
|
|
f₂ = frequency of next class, h = class width |
Summary Table
|
Data Type |
Examples |
Key Features |
|
Qualitative (Categorical) |
Eye color, types of fruit |
Describes categories, not numbers |
|
Quantitative Discrete |
Number of siblings |
Whole numbers, countable |
|
Quantitative Continuous |
Height, weight |
Measurable, can include decimals |
|
Primary Data |
Surveys you conduct |
Collected first-hand |
|
Secondary Data |
Government statistics |
Collected by someone else |
|
Nominal Scale |
Gender, colors |
No order |
|
Ordinal Scale |
Satisfaction ratings |
Order, but no precise differences |
|
Interval Scale |
Temperature in Celsius |
Order + precise differences, no true zero |
|
Ratio Scale |
Age, height, weight |
Order + precise differences + true zero |
Conclusion
More than just calculations and formulas, statistics is a way of thinking about evidence, trends, and uncertainty. Knowing statistics gives you the ability to confidently analyse data and make wise decisions, whether you're studying for tests, conducting research, or getting ready for the workforce. You will develop strong statistical literacy that will benefit you throughout your life if you adhere to this methodical approach and practise regularly.
Frequently Asked Qusetions on Statitics
1. What do you mean by statistics?
Answer: Statistics is the science of collecting, organizing, analyzing, and interpreting data to help us understand patterns, make decisions, or draw conclusions.
In simple terms, statistics is how we make sense of numbers and information around us - like test scores, survey results, business profits, or sports data.
2. What are the 5 main statistics?
Answer: Here are five important measures often referred to as “main statistics” used to describe and analyze data:
-
Mean (Average) - Sum of values divided by the number of values.
-
Median - The middle value in a sorted list of data.
-
Mode - The value that appears most frequently.
-
Range - Difference between the highest and lowest values.
-
Standard Deviation - Measures how spread out the values are from the mean.
These five give a good basic picture of a dataset’s center and variability.
3. What is called a statistic?
Answer: A statistic is a numerical value calculated from a sample of data.
For example:
-
The average height of 50 students measured in your class is a statistic.
It’s different from a parameter, which refers to a number describing the entire population.
4. Which best defines statistics?
Answer: The best definition of statistics is:
“Statistics is the science of collecting, organizing, analyzing, and interpreting numerical data to make decisions, draw conclusions, or describe phenomena.”
It’s both about methods for working with data and about drawing meaningful insights from data.
Learn more and explore engaging math concepts at Orchids The International School. Build strong problem-solving skills with ease.
Related Links
CBSE Schools In Popular Cities
- CBSE Schools in Bangalore
- CBSE Schools in Mumbai
- CBSE Schools in Pune
- CBSE Schools in Hyderabad
- CBSE Schools in Chennai
- CBSE Schools in Gurgaon
- CBSE Schools in Kolkata
- CBSE Schools in Indore
- CBSE Schools in Sonipat
- CBSE Schools in Delhi
- CBSE Schools in Rohtak
- CBSE Schools in Bhopal
- CBSE Schools in Aurangabad
- CBSE Schools in Jabalpur
- CBSE Schools in Jaipur
- CBSE Schools in Jodhpur
- CBSE Schools in Nagpur
- CBSE Schools in Ahmednagar
- CBSE School In Tumkur


Orchids The International School is one of India's leading chains of CBSE and ICSE schools, with 100+ schools across the country.